This is Part 2. Follow links for Part 1, 3, 4, 5, 6, 7 and 8.
Most investors think that passive portfolio construction is mainly about asset allocation.
- U.S. vs International
- Stocks vs Bonds
- Developed vs Emerging markets
In this part we will look more closely at the mechanism that determines how portfolio weights evolve over time.
Two portfolios can start by owning nearly identical global equities but will produce materially different long-term outcomes if they use different “weight update engines.”
After running long-horizon backtests comparing Vanguard Total World Stock Index Fund against regional slice portfolios, we analyze the three distinct structural engines at work:
- Float-adjusted indexing
- Momentum like Return-adjusted drift
- Rebalancing using value-investing mechanics
And note that each one behaves very differently.
The Three Portfolio Engines
1. VT: Float-Adjusted Global Indexing
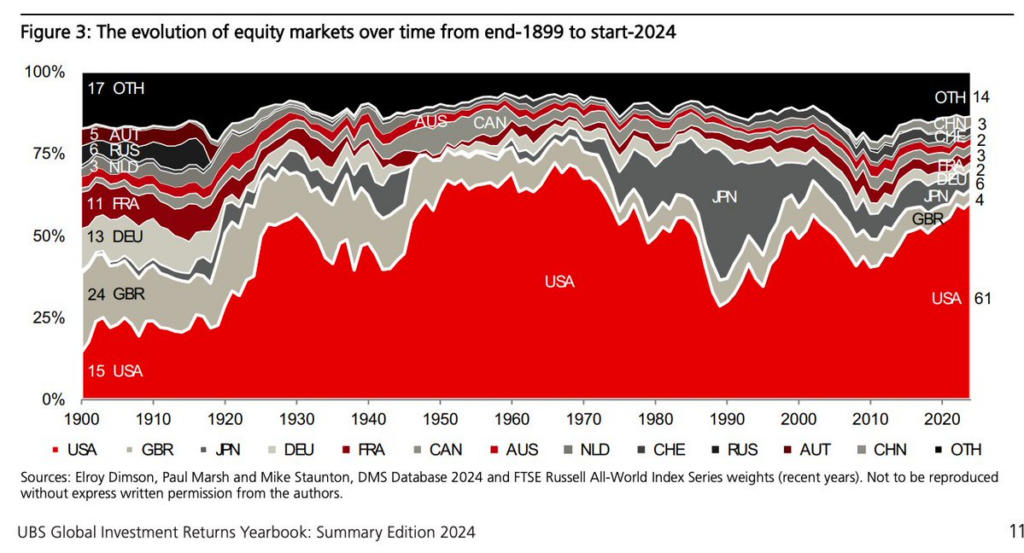
A fund like Vanguard Total World Stock Index Fund is not simply “the world market” or the “total market portfolio” in the theoretical CAPM sense.
It is the world market weighted by float-adjusted market capitalization.
VT continuously changes its internal regional weights based on:
- price appreciation
- new share issuance
- buybacks
- changes in investable float
- index reconstitution, etc.
Why Float Growth Matters
Float growth is not the same thing as investor return.
In many cases, heavy equity issuance is actually associated with:
- dilution
- lower per-share growth
- lower future returns
This has been extensively documented at both the company and country level.
A company can double its market cap through:
- genuine appreciation
- or massive issuance
VT treats both similarly because both increase float-adjusted capitalization.
That means VT Slices are not purely “following returns.” They are also including market cap flows using a float adjustment mechanism.
2. Buy&Hold Slice Portfolios: Return-Adjusted Weights
Now compare that with a regional slice portfolio.
Example:
- 60% U.S.
- 40% international
under pure buy-and-hold.
- No rebalancing.
- No float adjustment.
- No issuance-based reallocations.
Weights drift only because of realized returns.
If U.S. outperforms international for decades, the portfolio gradually becomes more U.S.-heavy entirely through compounding.
In our backtest the P2(B&H) portfolio started at 60/40 U.S./International and eventually drifted to roughly 81/19 by the end of the period.
That is an enormous shift. To get the exact shift magnitude, we tested P2(B&H) with 69.24/30.76 starting weights same as P1 (VT). The end weights for P2(B&H) were 86.89/13.11.
This creates a very different structural exposure engine than P1 (VT) because by comparison US started at slightly above 69% and in May 2026 it ended at 61.5% effectively moving in the opposite direction.
That is a ~25.5 percentage-point divergence in U.S. weights at the end of the period between a Buy & Hold slice and VT. VT’s float adjustment dampened US weights relative to P2’s return drift.
The Key Distinction
VT weights are float-adjusted.
Buy-and-hold slice weights are return-adjusted.
That may sound subtle, but the long-term implications are large.
VT partially resists pure return drift because it continuously reintroduces float-weight logic into the portfolio.
A sliced buy-and-hold portfolio simply lets winners compound.
In effect:
- VT continuously incorporates relative float dynamics
- Buy & Hold slice portfolios let market returns alone determine future weights
How to compute float drift:
SliceFA : Slice float adjustment factor
w[t] : Slice weight in VT at year start
w[t+1] : Slice weight in VT at year end
SliceReturn : Slice nominal return (%+1)
VTReturn : VT nominal return (%+1)
Over the 56-year window, U.S. equities outperformed International. The B&H slice portfolios captured that outperformance fully by letting weights drift with returns. VT’s float-adjustment mechanism partially suppressed it by periodically trimming the U.S. allocation and adding back to international.
Example: For P2’s assets over the 1970-2025 sample, USFA = 0.9862 and xInternationalFA = 1.0108. US weights grew 1.38% less and International weights grew 1.08% more than a purely return-driven weight evolution would imply. This deviation reduced exposure to the high-return region (US) and increased exposure to the low-return region (International) accounting for the 0.64% annualized return difference between P1 and P2(B&H).
3. Rebalancing: The Contrarian Overlay
Once rebalancing is introduced, a third engine appears.
Now the portfolio mechanics switch from momentum drift to “buy low sell high” value investing like mechanics.
Rebalancing systematically:
- trims outperformers
- adds to under-performers
That is fundamentally a value or contrarian process.
So we now have three distinct systems:
| Structure | Dominant Mechanism |
|---|---|
| VT | Float-adjusted allocation |
| B&H Slice | Return momentum |
| Rebalanced Slice | Contrarian overlay |
Momentum vs Value Inside Portfolio Construction
What makes this interesting is that investors often discuss:
- momentum investing
- value investing
as explicit factor strategies.
But those same dynamics may already exist implicitly inside portfolio construction itself.
A buy-and-hold slice portfolio naturally behaves like a passive return momentum system:
- return winners become larger weights
- losers shrink
Rebalancing overlays a value discipline:
- sell relative winners
- buy relative laggards
Meanwhile VT introduces a separate force entirely:
- float market cap based weighting
Most investors never think about this distinction because all three approaches are casually labeled “passive indexing.”
But structurally, they are very different.
Is VT “Wrong”?
No.
VT still provides:
- excellent diversification
- simplicity
- tax efficiency
- low maintenance
- strong behavioral advantages
For many investors, those benefits dominate everything else.
VT embeds a specific weighting philosophy:
- float-adjusted capitalization
A B&H sliced portfolio embeds a different philosophy:
- returns determine weights
And a rebalanced sliced portfolio adds yet another:
- periodic contrarian reversion
Once you see these as different portfolio engines rather than merely different fund combinations, many of the long-run performance differences become easier to understand.
Final Thoughts
Because the US outperformed and tended to have more disciplined capital issuance (heavy buybacks, lower net issuance or even net retirement of shares), its float grew more slowly relative to its price performance. International markets, with more issuance in many cases, saw faster float growth.
Result: VT periodically “sells” some of the outperforming US (relatively) and “buys” more of the underperforming international to stay float-cap weighted. It leans against the long return slice return trend and at a macro level appears to do something similar with rebalancing.
A fixed weight rebalancing strategy hopes to profit from mean reversion (laggards catch up). Float-adjustment doesn’t care about buy low sell high it just mechanically tracks investable float.
In this 56-year historical period, the float-adjusted capitalization mechanism acted like an unintentional contrarian, systematically trimming the outperforming region and adding to the under-performer, but unlike deliberate rebalancing, it ended up reducing returns rather than enhancing them.
Weights can evolve based on :
- float growth
- investment returns
- periodic contrarian rebalancing
Those are fundamentally different mechanisms and over very long periods of time, the choice appears to matter far more than most passive investors realize.
Disclaimer: This blog post is for informational purposes only and should not be considered financial advice. Consult with a qualified financial advisor for personalized guidance.
Leave a Reply