This is Part 1. Follow links for Part 2, 3, 4, 5, 6, 7 and 8
For years, the default advice for global equity investing has been simple: “VT and Chill” – buy a total-world index fund like Vanguard Total World Stock Index Fund ETF Shares (Ticker: VT) and leave it alone. These funds are designed to provide broad global diversification in a single package.
But there is an important question hiding underneath that simplicity:
Does owning the world through a single cap-weighted fund somehow leave opportunities on the table?
To explore that question, we ran a 56-year backtest comparing a pure global-market portfolio against several “regional slice” portfolios employing buy and hold (B&H) and different rebalancing strategies.
The results were surprisingly consistent.
The Portfolios
We thought about what is the best way to set slice weights for this portfolio simulation, the options were:
- Simulation starting year uses VT slice weights
- VT average slice weights for the test period (this would be mathematically the most fair; it’s about 51% US)
- How an investor would have allocated his money at the time of simulation start. This in most cases would have been more than 80% US. Vanguard had about 80% US equity allocation in their target date funds in 2006 which aligns with J. Bogle recommendation from the “Common Sense on Mutual Funds” book.
- Current Vanguard’s policy applied retroactively in a way that would consider home country bias but not overly favor a US allocation.
We chose option 4 and found the current Vanguard position which states:
In general, Vanguard recommends that at least 20% of both stocks and bonds in your portfolio should be held in international investments. However, to get the full diversification benefits, consider investing about 40% of your stock allocation in international stocks and about 30% of your bond allocation in international bonds.
Vanguard’s fund of funds, such as target retirement date funds currently follow this 60% US target allocation. Also an article form 2023 seems to confirm that as well:
Vanguard media spokesperson, who replied, “Specifically, our lead recommendation to advised clients is 40% international equity exposure, 60% U.S.”
Thus we settled for our benchmark portfolios at 60% US. Additional slice allocations: Europe, Pacific and Emerging Markets, were based on historical data.
The experiment that we set-up here is not: which portfolio wins under identical starting conditions? Instead we are comparing a market-cap portfolio to reasonable real investor portfolio choices held over a long time period.
P1: Global Market Portfolio
- 100% VT, Vanguard Total World Stock Index Fund ETF Shares equivalent
This serves as the baseline.
P2: Simple U.S. / International Split
- 60% VTSAX, Vanguard Total Stock Market Index Fund Admiral Shares
- 40% VTIAX, Vanguard Total International Stock Index Fund Admiral Shares
P3: Developed / Emerging Market Slice
- 60% VTSAX, Vanguard Total Stock Market Index Fund Admiral Shares
- 32% VTMGX, Vanguard Developed Markets Index Fund Admiral Shares
- 8% VEMAX, Vanguard Emerging Markets Stock Index Fund Admiral Shares
P4: Deeper Regional Slicing
- 60% VTSAX, Vanguard Total Stock Market Index Fund Admiral Shares
- 20% VEUSX, Vanguard European Stock Index Fund Investor Shares
- 12% VPADX, Vanguard Pacific Stock Index Fund Admiral Shares
- 8% VEMAX, Vanguard Emerging Markets Stock Index Fund Admiral Shares
Rebalancing Strategies
Three approaches were tested:
| Strategy | Description |
|---|---|
| B&H | Buy and Hold (no rebalancing) |
| R-1y | Rebalance once per year |
| R-5/25 | Rebalance only when allocation drifts by either 5 percentage points absolute or 25% relative to target |
The 5/25 rule is commonly discussed in Boglehead-style portfolio management because it reduces unnecessary trades while still harvesting meaningful drift.
The results
| Portfolio | B&H Return | B&H Stdev | R-1y Return | R-1y Stdev | R-5/25 Return | R-5/25 Stdev |
|---|---|---|---|---|---|---|
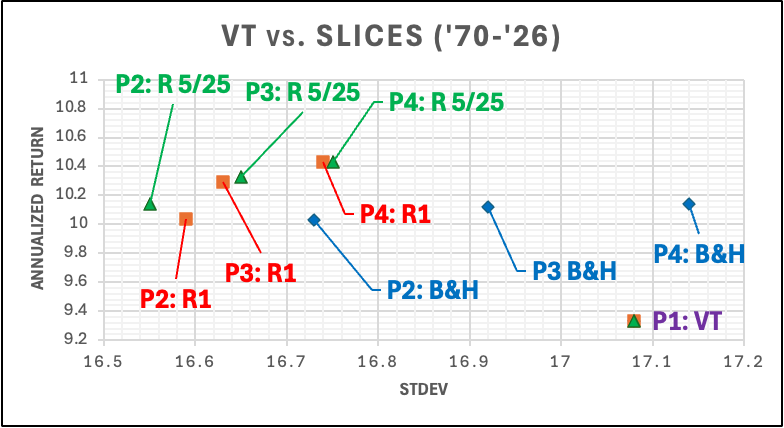
| P1 | 9.33% | 17.08% | 9.33% | 17.08% | 9.33% | 17.08% |
| P2 | 10.03% | 16.73% | 10.04% | 16.59% | 10.14% | 16.55% |
| P3 | 10.12% | 16.92% | 10.29% | 16.63% | 10.33% | 16.65% |
| P4 | 10.14% | 17.14% | 10.43% | 16.74% | 10.43% | 16.75% |
What Stood Out
1. Regional Slicing Beat VT Even Without Rebalancing
Even under the pure Buy & Hold policy, all sliced portfolios outperformed the global-market portfolio.
Compared to P1 (100% VT allocation):
- P2(B&H) added +0.64% annualized return (1.1003/1.0933 – 1)
- P3(B&H) added +0.72%
- P4(B&H) added +0.74%
That is a large difference over multi-decade horizons. Of note, as we mentioned above, the US starting weights in the B&H slice portfolios were 60% instead of 69.24% for P1 (VT). In comparative tests this favors P1 (VT) given that the US slice had significantly higher returns than International in 1970.
The B&H sliced portfolios outperformed the global market-cap portfolio. One likely explanation is that a global market-cap portfolio such as Vanguard Total World Stock Index Fund automatically increases exposure to regions that have their relative share of global market capitalization rise. In contrast, the sliced B&H portfolios only allow that drift through returns.
Over multi-decade periods, that structural difference alone produced materially different outcomes.
2. Rebalancing Improved Both Return and Risk
Also an interesting result was what happened after rebalancing.
All sliced portfolios experienced:
- lower standard deviation
- higher geometric returns
This is the classic “rebalancing bonus.”; It’s only named “bonus” when is positive the outcome neutral term is “diversification return”.
For example:
- P4(B&H): 10.14% annualized return with 17.14% Stdev
- P4(R1): 10.43% annualized return / 16.74% Stdev
- P4(R-5/25) : 10.43% annualized return / 16.74% Stdev
Higher return and lower volatility is difficult to ignore.
Understanding the Diversification Return
The diversification return measures the annualized return difference between a rebalanced and a B&H portfolio when both start with the same assets and weights.
In our case different regions did not move in lockstep:
- U.S. stocks lead for a decade
- then international outperforms
- Emerging markets surge and crash
- Europe lags
- Pacific markets recover
A sliced portfolio creates independent volatility streams.
Rebalancing systematically sells portions of the recent winners and buys portions of the recent laggards. Also known as: buy low sell high.
When asset prices display mean reversion and are imperfectly correlated rebalancing can produce a positive bonus.
This effect becomes stronger when:
- volatility is high
- correlations are lower
- dispersion between regions increases
- assets have similar returns
That is exactly what international equity markets have historically provided.
Final Thoughts
This experiment does not prove that VT is “bad.” Simplicity has enormous value:
- fewer funds
- easier management
- lower behavioral risk
- less temptation to tinker
But it does suggest something important:
The structure of a portfolio matters, not just the underlying assets.
Two portfolios that start by owning nearly identical global equities will produce meaningfully different long-term outcomes depending on:
- how exposure is partitioned
- how drift is handled
- whether rebalancing is allowed to harvest volatility
The evidence here suggests that regional slicing combined with disciplined rebalancing may provide a measurable structural advantage over a pure cap-weighted global approach.
And unlike tactical allocation strategies, this approach remains simple, transparent, and fully passive.
We used PrincetonAsset’s Portfolio Backtest Tool to compute portfolio returns. Asset class data used is comprised of their corresponding MSCI index (DMS for EM before 1987) and live Vanguard Fund returns.
Other technical aspects of note:
1. VT in a taxable account does not capture the foreign tax credit because it holds less than 50% in foreign stocks, a ~0.092% tax drag.
2. Expense ratios for P1(6bps), P2(6bps), P3(5.04bps) and P4(6.12bps) are very close.
3. P2-4 provide better opportunities for tax loss harvesting
4. P2-4 rebalancing can incur tax and transaction fees though directed dividend reinvestment can lessen the impact.
5. P1(10041) owns less stocks than P2(12264), P2(13719) or P4(13411).
CONTINUE TO PART 2 ->
Disclaimer: This blog post is for informational purposes only and should not be considered financial advice. Consult with a qualified financial advisor for personalized guidance.
Leave a Reply